Tools for PHP debugging
PHP advanced debugging tools
Past few days, I have encountered a few issues and bugs in the Google Cloud’s PHP library as part of my rotation duty within Google. While attempting to fix them, I have been researching various tools that can help in debugging some of the difficult PHP problems such as memory leaks, library hang, high resource usage and slow code paths. If these are also the problems that you encounter with your PHP program, then please read on.
xDebug
One can start debugging any PHP program or project, using xDebug. It is a PHP extension that needs to be added to the php.ini configuration. Once added, we can instantiate various modes like debug, profile and trace. But the most useful is the ability to use breakpoints in VsCode using xDebug. Following this dev.to blog, one can set up multiple PHP versions on mac to be better positioned to repro issues in various PHP environments. It works well with very few configuration changes when the PHP program is run standalone, on a remote machine or inside a docker container. This unblocks a host of debugging functionalities, such as Debug Console, interactive debugging, etc on VsCode. There are other debuggers also like Zend, PHP debugger, etc but I use xDebug.
Program State
Half of debugging is around comparing the expected vs actual state of the program. The following commands are handy to get and print that information.
-
echoprints the values of the arguments provided. -
debug_backtrace()returns an array of information about the calling functions. -
var_dump()can inspect the properties and methods of an object. -
get_class_methods()gets a list of all the methods defined in a class. -
get_class_vars()gets a list of all the properties defined in a class. -
curl_getinfogets details of a curl transfer.
These commands can be used in conjunction too, like below:
function debug($var) {
    $backtrace = debug_backtrace();
    $caller = $backtrace[0];
    echo "Caller: {$caller['file']}:{$caller['line']}\n";
    var_dump($var);
}
Sometimes, logging levels are not appropriately set and need to be enabled using: error_reporting(), ini_set() or error_log() functions.
Most common debugging use cases can be easily satisfied via xDebug and asserting on variable states. But for cases when one needs to debug large code paths, such as while debugging memory leaks, or resource profiling, we need other tools which can surface that information so that a developer can make a hypothesis on what could be going wrong.
PhpSpy
PHPSpy is a relatively new tool that allows tracing the execution of any PHP script, and seeing the function calls and variable assignments as they happen. It can be a useful tool for profiling PHP code, as it gives a detailed view of what is happening behind the scenes. It can generate a call graph, showing which functions are hot and where sleep are introduced.
Example: a typical flame graph generated by phpspy for running download_object_into_memory sample (ref link) in php-docs-samples.

The above SVG image shows that while downloading objects from Google Cloud Storage, there is a single thread of execution and curl is where the thread waits the most and authentication takes just less than 2% of the total time to download the object.
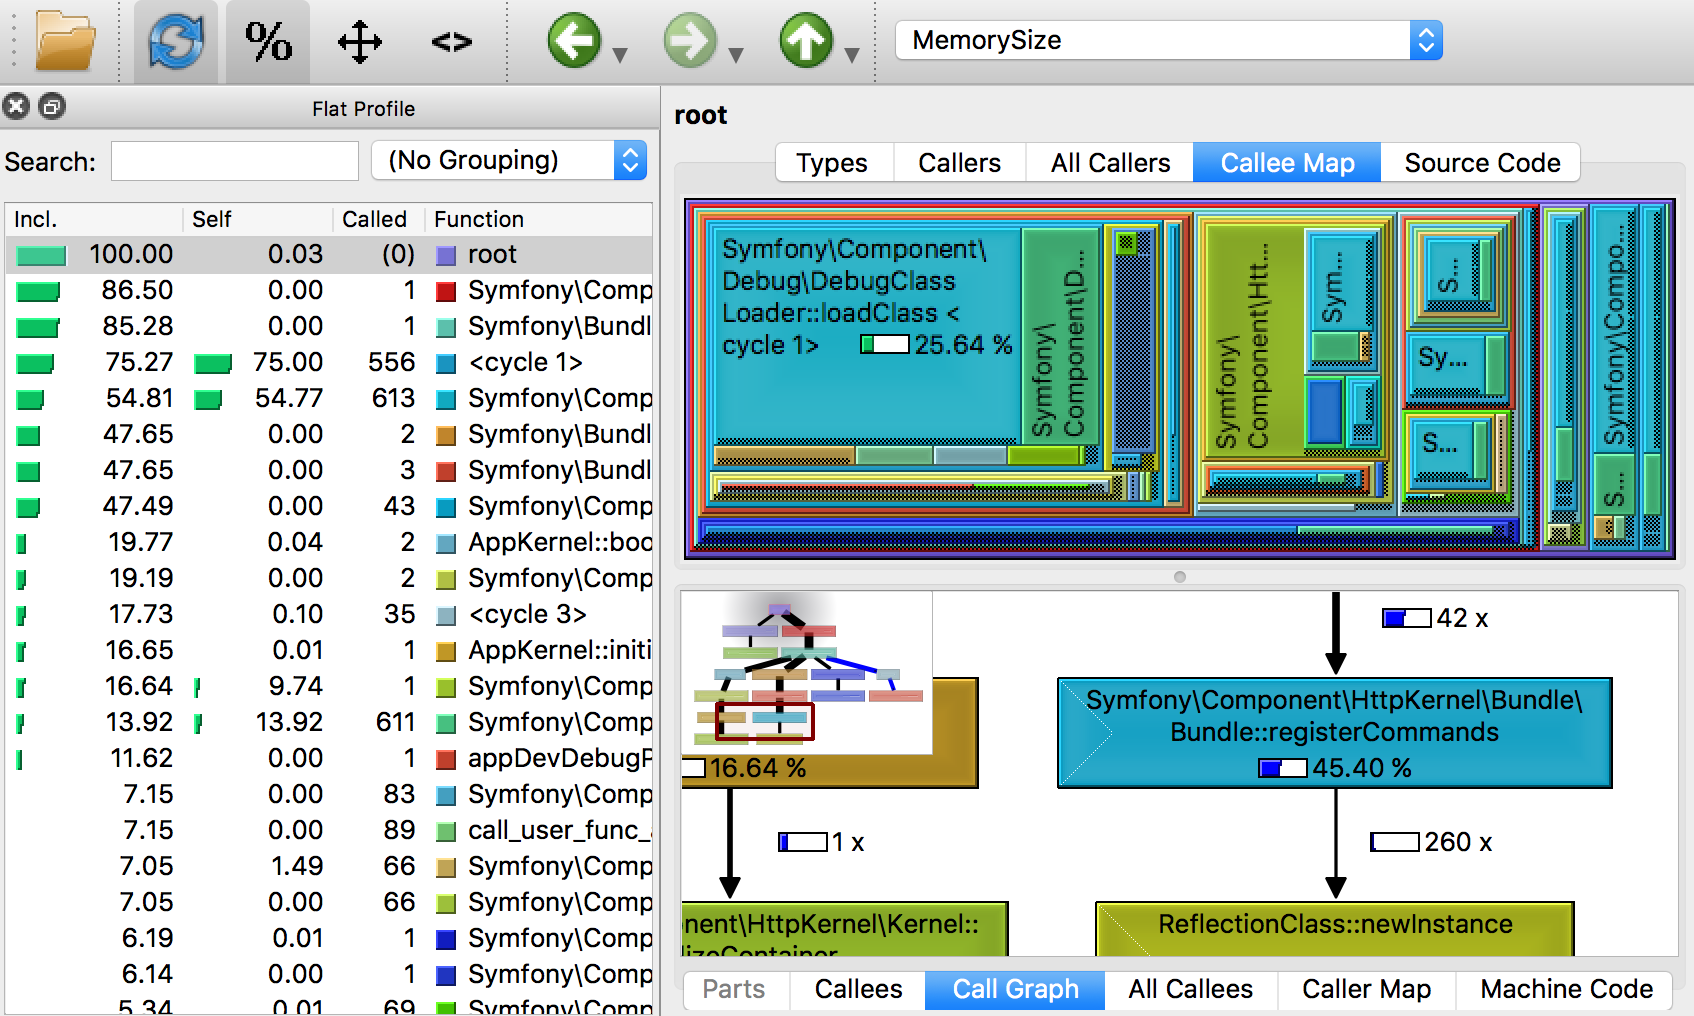
MemProf
php-memprof is a fast and accurate memory profiling extension for PHP that can be used to find the cause of memory leaks. It has a dependency on libjudy, so scripts run using php -dextension=memprof.so flag. After this, memprof dump destination needs to be added like this: memprof_dump_pprof(fopen("profile.heap", "w")); in the PHP script and it generates a heap like below and the memory footprint of a program becomes instantaneously visible:
Conclusion
Dear Readers, Merry Christmas.


May the new year bring cheer to everyone’s hearts.
More than just knowing about the PHP tools, it is important to be able to use them when needed. For that purpose, one may need to keep bash functions already handy which can make things easy. Hope the above information comes useful to those stuck with any nasty bug in their PHP codebase.
TECH
PHP plugin API